I was recently facing a problem with first requests into a double entry financial ledger service taking more than double of subsequent requests. This got me digging into Java’s Ahead-Of-Time Cache (AOT) and Spring.
I was under the wrong impression that AOT is only about startup speedup, but looking a bit through recent AOT JEP additions found out each one will bring something to the first request.
- JEP 483: Ahead-of-Time Class Loading & Linking (JDK 24)
- JEP 515: Ahead-of-Time Method Profiling (JDK 25)
- JEP 516: Ahead-of-Time Object Caching with Any GC (JDK 26)
So here’s the setup:
- Java 26 - because of AOT with any GC.
- Spring Pet Clinic REST repo, to test a usual Java REST stack. Latest Spring Boot version at the moment.
- k6 - to ‘train’ the JVM and show performance under different configuration.
And here the scenarios:
- baseline-g1 - no AOT cache, default G1 garbage collector.
- aot-g1 - testing with AOT cache and G1.
- baseline-zgc - no AOT, using ZGC - concurrent garbage collection as opposed to G1 stop-the-world type, which can cause some spikes in latency (or at least I was thinking so).
- aot-zgc - cache + ZGC.
For each scenario I ran the service with -XX:AOTCacheOutput creating the cache, then with -XX:AOTCache multiple executions to get more accurate statistics.
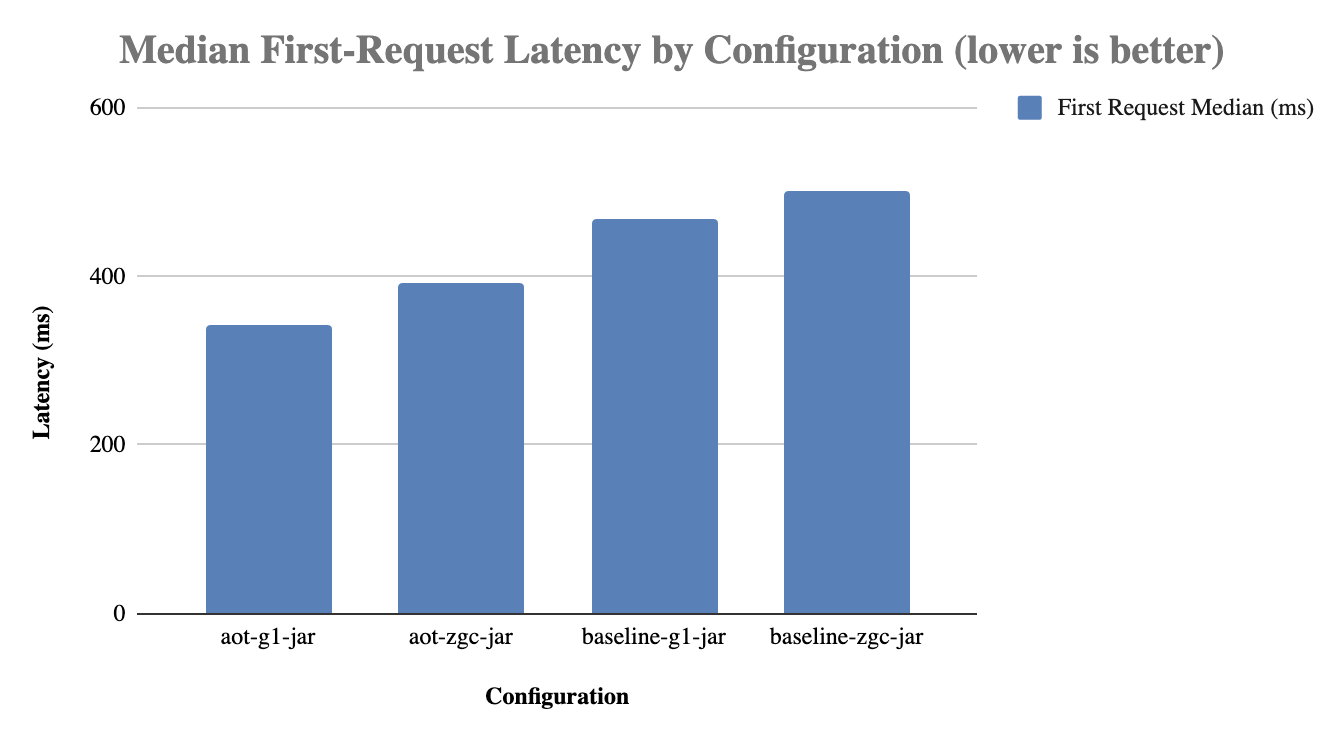
The results are not impressive but a real consistent improvement can be seen:
- G1 Garbage Collector
- Median Latency: AOT is ~27% better (342.53 ms vs 467.52 ms).
- Minimum Recorded: AOT achieved 299.04 ms, while baseline achieved 388.87 ms.
- Maximum Recorded: AOT hit 378.20 ms, while baseline hit 723.58 ms.
- ZGC Garbage Collector
- Median Latency: AOT is ~22% better (392.19 ms vs 501.80 ms).
- Minimum Recorded: AOT achieved 320.35 ms, while Baseline achieved 424.74 ms.
- Maximum Recorded: AOT hit 524.59 ms, while Baseline hit 579.85 ms.
It wasn’t a smooth test at the beginning. My runs with AOT cache were silently failing to load cache, as a result I was getting the same latency as baseline. After some digging I found out that my problem Error occurred during initialization of VM when using AOTCache was caused by a custom Java image I was using in Docker. There is already a bug on this - JDK-8381222. After switching from eclipse-temurin:26-jre-jammy to eclipse-temurin:26-jdk-jammy, the cache finally started to work.
Even with the seen improvement I wasn’t happy since there is a 97% worse latency between first request and subsequent ones: 433.58 ms first request vs 10.40 ms subsequent requests.
I had to check what is happening with Spring during this first request. Starting the JVM with the Flight Recorder (-XX:StartFlightRecording) and then analyzing the dump in JDK Mission Control gave me some pretty decent insight.
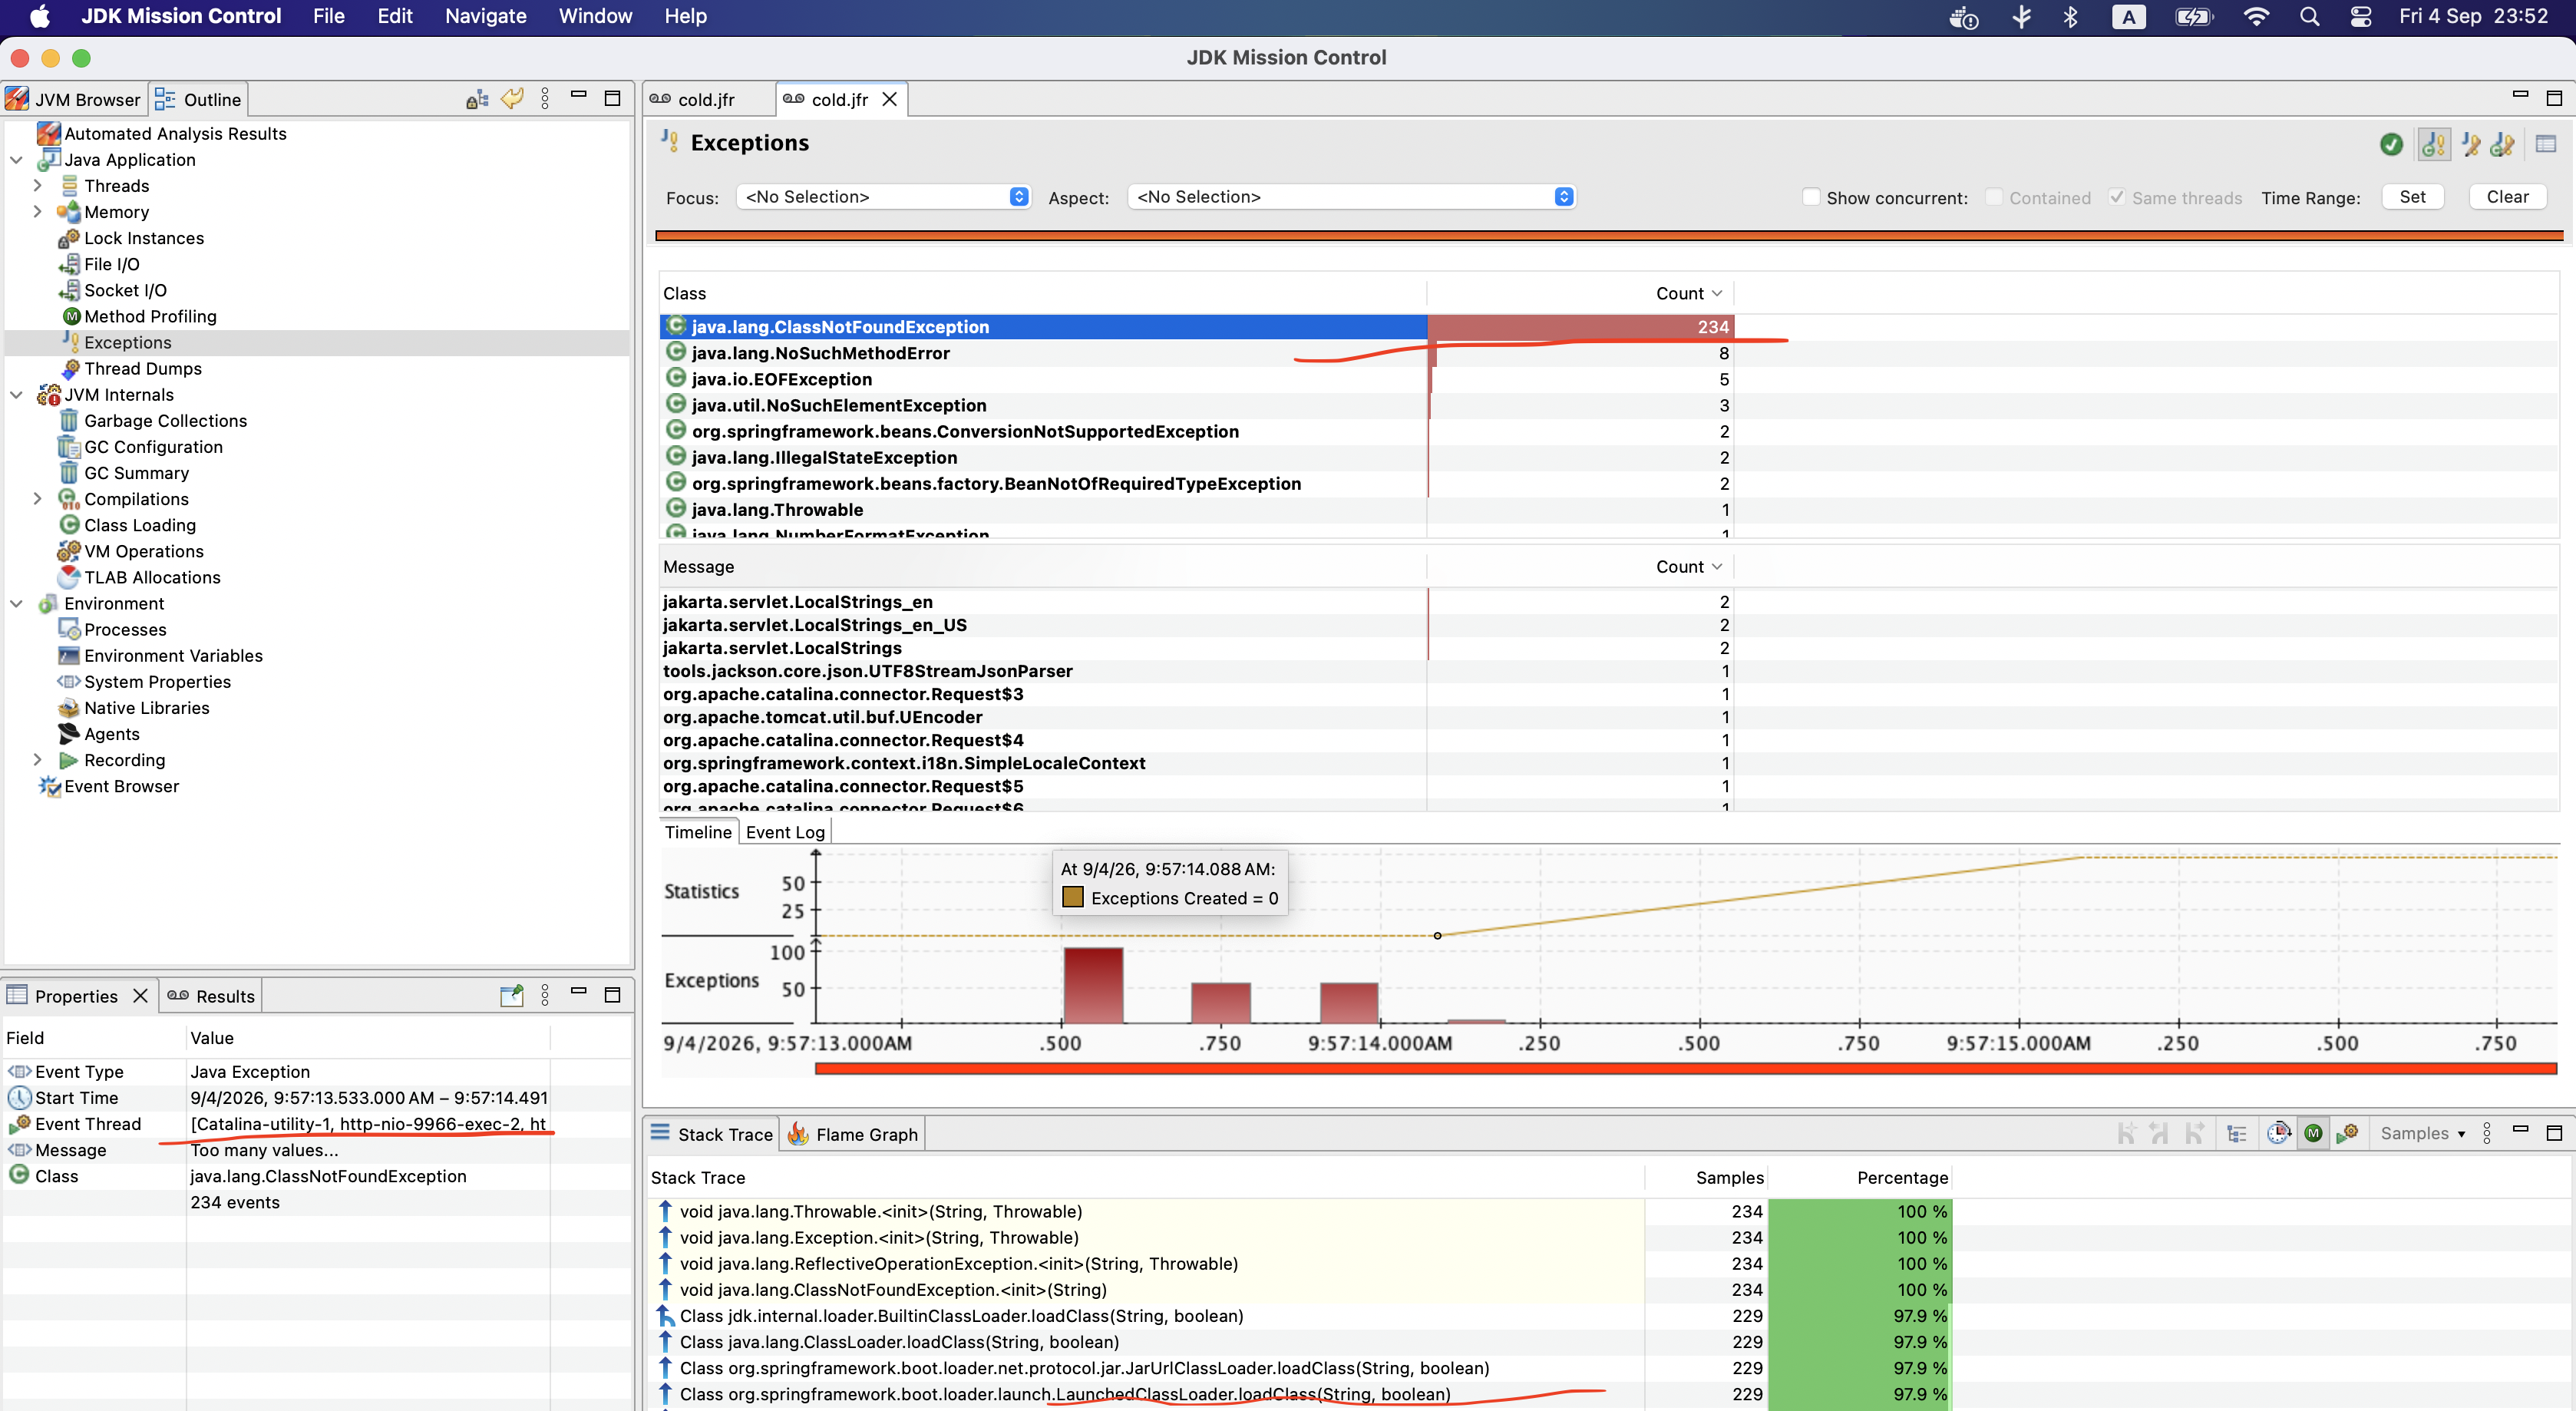
Based on the above and a bit of clicking around, I found out that Spring Boot shipped as a fat jar (so it can be run as java -jar), provides a custom class loader, since the JVM cannot natively load the classes from nested jars.
This class loader through loadClass invocation just delegates to JDK that doesn’t know about nested jars structure and at some point throws class not found (2). The exception handler then calls findClass (3) that actually can find the class.
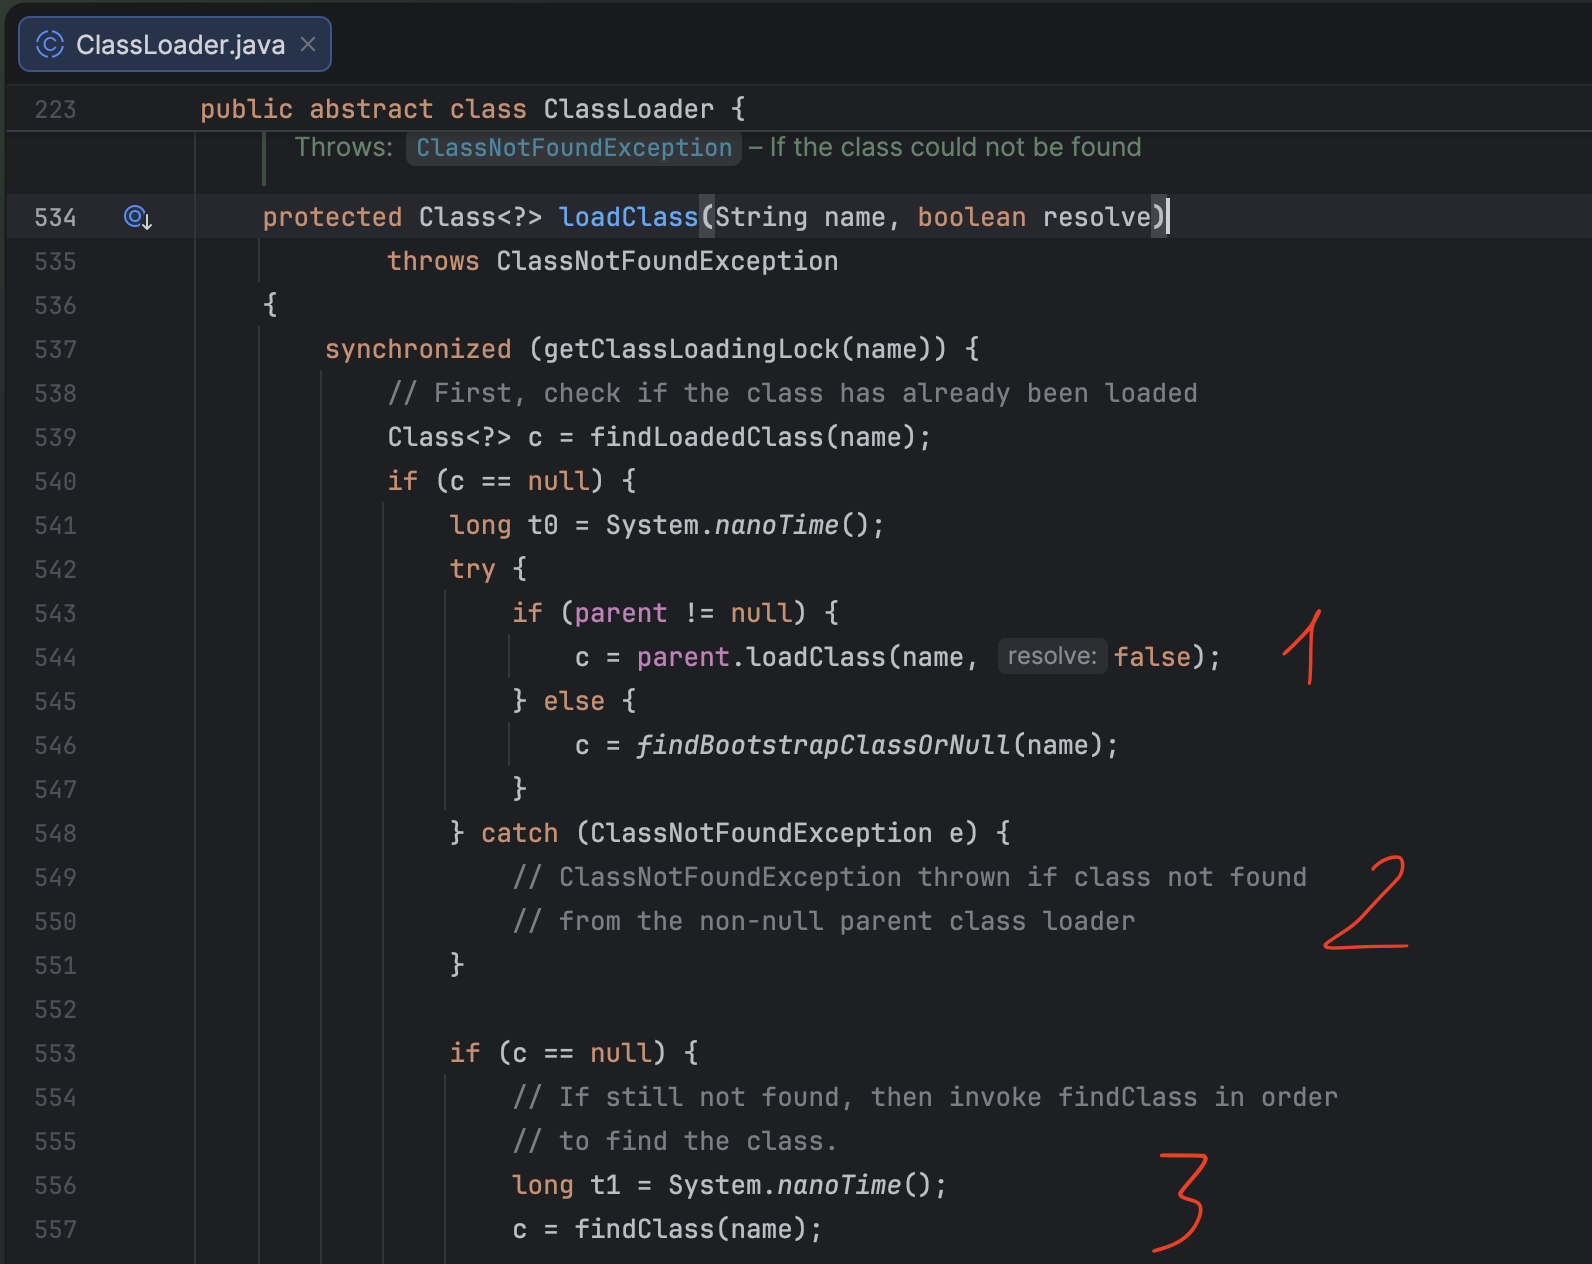
This happens for every class that needs to be loaded from nested jars for the first time. Some of the classes are loaded at startup, but some of them like Jackson for DTO, Hibernate for the database query etc. are done at first HTTP request.
For the next tests I built another dockerfile that bypasses the fat jar and instead launches the app through the real main class. It’s a documented solution (see example 3), not some hacky workaround.
And the results were astounding, 85.37 ms latency, as opposed to around 467.52 ms measured from baseline. That’s ~82% latency drop.
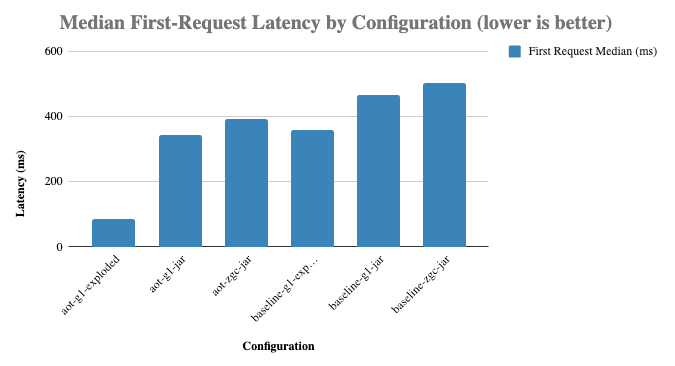
Worth noting that aside from first request, all subsequent requests maintained a steady 8 - 9 ms latency no matter the config.
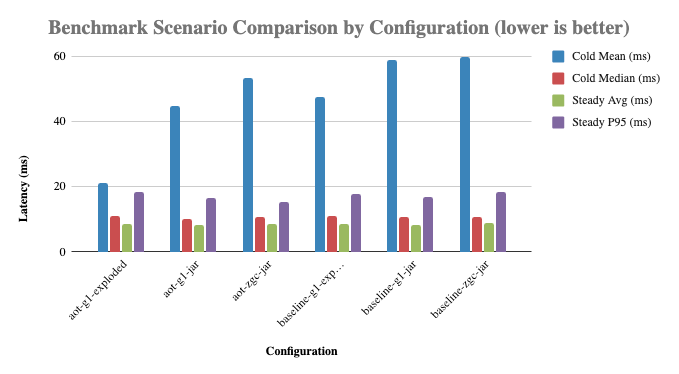
All the scripts to run the tests as well as full results used for this article can be found here.